A fundamental aspect of every ETS Human Progress Report is the Human Progress Index (HPI), a measure of how difficult or effortless it is for people to access the foundational factors for progress, such as education, upskilling and reskilling. A score above 100 indicates that the task is generally easier for respondents, while a score below 100 indicates it is relatively difficult. But how does this number translate to lived experience? An initial review of 15 state-level reports1 offers some insight.
When comparing each state's HPI score against the upskilling barriers workers report: cost, time and employer support — a clear relationship emerges. States with a low HPI score are the same states where workers report the most friction trying to build new skills. States that score high are the same states where that friction is lowest. This correlation shows HPI score is more than a number; its capturing something real and specific about the on-the-ground experience of trying to move forward economically.
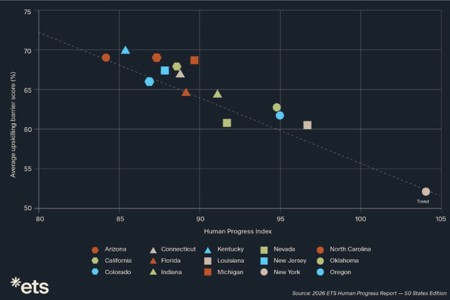
Graph to show the relationship between Human Progress Index and average upskilling barrier score for time, cost and employer support.
How barriers translate to lived experience
For states clustered at the low end of the HPI — North Carolina (84.1 ranking 48th for HPI across all 50 states and the District of Columbia), Kentucky (85.3 ranking 47th), Colorado (86.8 ranking 42nd) — the average upskilling barrier score is higher.
In the survey, barriers show up as checkmarks against: "difficulty finding time to learn new skills," "difficulty paying costs associated with upskilling," "difficulty getting employer support". As lived experiences, these checkmarks belong to the night-shift worker who can't find a training program that runs outside their hours. The parent who could afford a course, if it weren't also the month the car needed new brakes.
| Time | Cost | Employer Support | |
| North Carolina | 72% | 74% | 62% |
| Kentucky | 69% | 76% | 66% |
| Colorado | 65% | 74% | 60% |
| National | 63% | 68% | 57% |
Table to show barriers and percentage of people experiencing them in low-HPI states and the national average.
Barriers are everyday obstacles that, added together, are enough to keep someone standing still while the job market moves on without them. In low HPI states, a majority of workers are running into at least one of these walls, and often more than one at once.
What it looks like when the walls come down
In states near the top of the index, like New York (104.0, ranking 8th out of 51 states), upskilling still costs money and still takes time, but the friction around it is measurably lower. Fewer people say costs stop them upskilling (55% vs. 68% nationally). Fewer say they can't find the hours to learn (54% vs. 63% nationally). And meaningfully, fewer people report difficulty getting employer support (48% vs. 57% nationally), whether that means covering tuition, adjusting a schedule or simply treating a certification as worth supporting rather than ignoring.
Nothing in this data suggests workers in low-HPI states want to learn new skills any less than workers in New York do. The gap is in the systems around them, and whether they make it possible to turn ambition into action.
What this confirms about the index itself
It may be tempting to conclude that HPI is a proxy for wealth, that wealth removes barriers, and this explains the relationship between HPI and friction. But the index is specifically built around access: to education, to upward mobility, to the systems that let someone move from where they are to where they want to be. It’s not just the cost barrier that lifts with HPI score, time and employer support also ease up as the index rises.
This suggests an HPI score isn't just describing a state's economy from a distance; it's picking up something true about whether ordinary people, in ordinary jobs, can actually get where they're trying to go.
The finding has practical implications for anyone thinking about workforce mobility or economic development policy. If time, money, and employer goodwill all move together this closely, they're not three separate problems to solve — they're symptoms of the same underlying gap in access. A state that removes one of these walls is likely to be chipping away at the others too, and ultimately, improving its workforce mobility.
For further insight into the factors shaping human progress in U.S. states, read the 2026 ETS Human Progress Report — U.S. Edition.
1. Arizona, California, Colorado, Connecticut, Florida, Indiana, Kentucky, Louisiana, Michigan, Nevada, New Jersey, New York, North Carolina, Oklahoma and Oregon.